
Introduction
The Writing Task 1 section in the IELTS Academic exam assesses your ability to analyze and report visual information. In this task, you are usually given a chart, table, or process diagram, and you must write an accurate, organized, and concise report about it. The goal is to correctly interpret the data and describe key trends and changes using formal English.
Types of Charts and Processes
In Writing Task 1, you will typically encounter one of the following types:
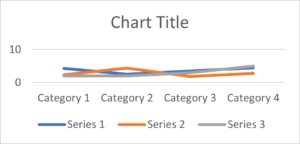
- Line Graph: Displays changes over time.
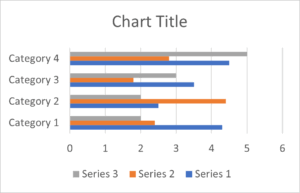
- Bar Chart: Compares different quantities.
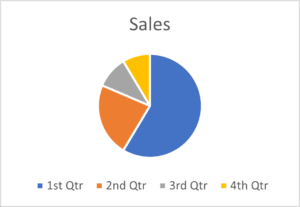
- Pie Chart: Shows percentages or proportions of different parts.
- Table: Presents numerical data in categories.
- Process Diagram: Describes the steps of a process or cycle.
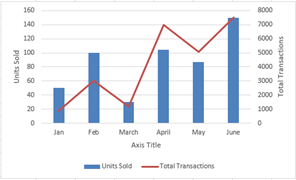
- Multiple Charts: A combination of different chart types.
Each type requires a specific approach to analysis and reporting, but the overall writing structure is usually similar.
Analysis and General Tips
Before writing, carefully examine the chart and consider the following:
- What type of data and units of measurement are used?
- What is the time period covered by the chart?
- What are the most important changes and trends?
- Are there any peaks or troughs?
- Is there information that should be compared?
Focus on Key Points and Major Changes
One important tip for Writing Task 1 is to focus on significant changes and highlights rather than describing every small detail. You do not need to explain the entire chart fully; instead, you should:
- Describe overall main trends.
- Identify major changes such as sharp increases or decreases.
- Highlight peaks and lows.
- Make important comparisons between data.
This approach makes your writing concise, clear, and easy to understand, helping you complete the task within the time limit.
Suggested Report Structure
To write a clear and professional report, it is best to divide your text into four parts:
- Introduction: Briefly introduce the topic of the chart in your own words.
- Overview: State the main trends or general features of the chart without details.
- Main Details: Explain important changes and data logically with figures and statistics.
- Further Details: Continue describing details and comparisons if needed.
Sample Example
Suppose you have a chart showing the number of visitors to three different museums over a year. Your report could start as follows:
- Introduction:
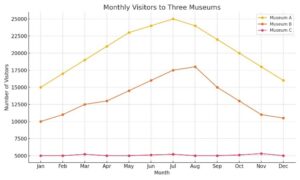
The line graph illustrates the number of visitors to three different museums over a twelve-month period.
- Overview:
Overall, Museum A consistently attracted the highest number of visitors, while Museum C had the lowest figures throughout the year. Both Museums A and B experienced fluctuations, but Museum C remained relatively stable.
- Main Details:
In January, Museum A had approximately 15,000 visitors, which gradually increased to a peak of 25,000 in July before declining towards the end of the year. Museum B showed a similar pattern but with lower
visitor numbers, starting at 10,000 and reaching 18,000 in August.
- Further Details:
Museum C’s visitor numbers remained steady at around 5,000 throughout the year, with minor variations in March and November.
Final Tips
- Time Management: Spend about 20 minutes on Writing Task 1, dividing your time between analyzing, writing, and proofreading.
- Use Formal Language: Avoid conversational language and write clear, precise sentences.
- Focus on Key Points: Only mention important changes and avoid minor details.
- Use a Variety of Vocabulary: Employ diverse words and phrases to describe trends to boost your score.